Software I like: gnuplot
To download, from the
download page
follow the link to the SourceForge download page and download, for example,
gp463-win32-setup.exe for M$ Windows.
When you run this installation
programme, a long ‘important information’ text is
displayed and a number of choices are offered whose meanings may not
be clear even after reading the important information.
You can just accept all of the default settings –
things can be changed later. (You may want to deselect
Associate gnuplot with the .plt file extension
because the .plt file extension is often used
by other software.)
A second, even longer
‘important information’ text is displayed
but it's just new features, changes and fixes since previous versions,
so you can ignore it if this is your first time using gnuplot.
Note that the gnu in the name is not related to the
GNU.
There's a lot of built-in help, although it can be
a bit confusing until you get the drift.
- As a trivial example
to get started, create a text file called
gnuplot_test.gnuplot_data in some directory.
(You can use something shorter than .gnuplot_data
as the filename extension if you want.)
Put a few lines of numbers into the file, two numbers per line, separated
by spaces or tabs. For example,
1 4
2 6
3 1
4 7
5 4
Run gnuplot and click the button
 in the toolbar. Browse to find the directory where you created
your data file. Then type in the command
in the toolbar. Browse to find the directory where you created
your data file. Then type in the command
plot "gnuplot_test.gnuplot_data"
(note the quotation marks) followed by
the Enter key. A window should
pop up with a plot showing the individual data points.
- The results may be underwhelming if the default symbol type is
+ and several of the data points are hard to distinguish
from the automatically scaled axes. To make the plot more visible,
add lines between the points by giving the command
set style data linespoints.
Then use the up-arrow key to select the
plot "gnuplot_test.gnuplot_data command again
and use the Enter key to execute it.
- A set of commands can be stored in a file and then executed
using the
load command. If you're using trial
and error to get the plot right and using the
load command repeatedly, it seems to be a good
idea to put a reset command at the beginning
of your command file, to make sure leftover settings don't
confuse things.
- Plotting output can be sent to a file in
various formats as specified by an output device
(or ‘terminal type’) such as
svg,
postscript, png. For example,
to output to an SVG file, give commands like
set terminal svg
|
set output '\c:\users\username\filename.svg'
|
To output to a .eps file, give commands like
set terminal postscript eps
|
set output '\c:\users\username\filename.eps'
|
The screen
corresponds to terminal type x11 under *n*x
and wxt or windows under M$ Windows.
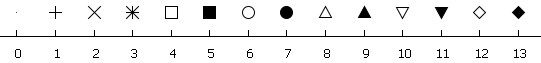
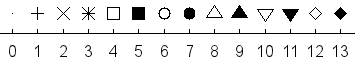
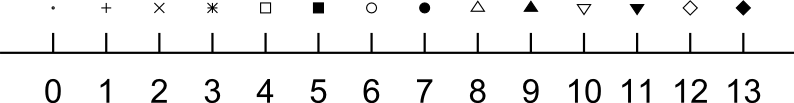
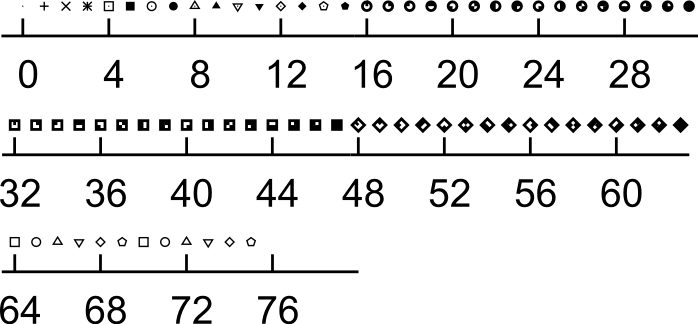
- Symbol types for plotting points are defined using an index number
which unfortunately varies from device to device and is
rather unorganized. If a symbol index is specified which is
larger than the number supported by a particular device,
the list of available symbols will be re-used in order;
for example, if there are 13 available symbols and symbol
type 16 is requested, then symbol type 3 will be used.
Except for PostScript, the number of symbols available is very
small and there is no built-in mechanism for adding additional symbols.
(There are some clumsy work-arounds using character labels or images.)
The following are the symbols available for a few terminals
in gnuplot 4.6.3 (2013 Nov 10):
Note that I have not taken care to get consistent scaling from the
different terminals, which does not happen automatically.
-
Colours for the symbols are defined using the
linetype index. For the terminal type
windows I see:
| | windows | svg | png | x11* | postscript
|
|---|
| 1
| red
| red
| red
| red
|
| 2
| green
| dark green
| green
| green
|
| 3
| blue
| blue
| blue
| blue
|
| 4
| magenta
| cyan
| magenta
| magenta
|
| 5
| dark blue
| dark cyan
| cyan
| cyan
|
| 6
| brown
| dark blue
| brown
| brown
|
| 7
| dark cyan
| light brown
| yellow
| dark yellow
|
| 8
| black
| dark cyan
| dark blue
| pinkish
|
| 9
| dark grey
| olive
| dark yellow
|
|
| 10
| dark green
| light blue
| dark green
|
|
| 11
| olive
| orange
| mauve
|
|
| 12
| purple
| purple
| dark brown
|
|
| 13
| light grey
| light green
| pink
|
|
| 14
| cyan
|
| green
|
|
| 15
| yellow
|
| dark cyan
|
|
| 16
|
|
| ...
|
*The actual X11 colours may be different, depending on how your
X11 resources are set.)
A much more general mechanism (e.g., rgbcolor "red")
is available from version 4.2; this avoids the horribly
inconsistent device-dependence, for colours if not for
symbol shapes.
- An SVG file created by gnuplot 4.0 could not be opened
by either Inkscape 0.45 or Firefox 2.0
but could be opened by The GIMP 2.2.10. An SVG file
created by gnuplot 4.2 can be opened by Inkscape and
The GIMP, but not by Firefox; there seems to be a
problem at the end of the file, with either no
tag or some spurious null characters before the tag.
Firefox also doesn't seem to handle some
symbol types, although this may be a side-effect of
the previous problem. The GIMP seems to have trouble getting
the colours of symbols, and renders some of them black.
R. Funnell
Last modified: 2013-11-10 18:35:21
 wxt
wxt
 windows
 png
png
 svg
svg
 eps
eps